View Code Explorer
Contents |
Action
Shows the Code Explorer Window
The code explorer shows code elements in a tree. By double clicking an element the cursor will be set to the matching code in the editor.
You can also drag an element into the editor window.
By clicking the right mouse a pop up menu will allow you to filter out constants and variables (registers) from the definition file.
The following code elements will be shown in the explorer:
- Aliases. These are the user ALIAS.
- Assembler. This is for single line asm using !
- Assembler Block. This is for assembler blocks using $asm .. $end asm. If you add comment after $asm, it will be shown in the tree as well. Example : $asm ; Test
- Constants. Both user defined constants (CONST) and constants from the definition file are shown.
- Declarations. Subs and Functions are both shown. Each with their own color.
- Functions. These are the user function implementations.
- Labels. When labels are used in subs and functions, the sub/functions name is listed first.
- Macros. These are the user macro's created with MACRO.
- Subs. These are the user sub implementations.
- Variables. These are the variables from the user code and definition file. Each shown with their own color. Locals are shown under a branch of the sub/function.
- CallStack. This is optional. Since it takes time to trace the call stack it is turned off by default. Use right mouse click and the pop up menu to activate it.
The call stack shows a tree of the calls you make to user subs and functions. And each sub/function also shows the user functions it calls.
When multiple calls are made, three dots are added for each additional call.
When the Code Explorer has the focus, pressing CTRL+F will search in the code explorer and not in the editor.
The code explorer works in a separate thread. It will be updated a few seconds after you have quit typing.
In version 2.0.7.7 the code explorer is considered a beta functionality. If an error occurs, contact support. By making the Code Explorer window invisible, the explorer is deactivated.
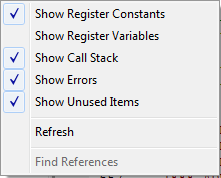
The popup menu has the following options:
Show Register Constants
This option can toggle between showing and hiding the register constants. When register constants are shown the tree can become big.
User constants and register constants are shown in a different color.
Show Register Variables
This option can toggle between showing and hiding the register variables. When register variables are shown the tree can become big.
User variables and register variables are shown in a different color.
Show Call Stack
This option can show the Call Stack. This reveals the nesting of your code.
Show Errors
This option deserves a warning. The option is turned off by default. It can be useful to find errors but it can also point to errors which are not considered an error for the compiler. The compiler has a separate parser. The parser from the IDE is a different new parser. When the definition files are fully updated, the errors shown will be similar to the errors the compiler will report. At the moment of updating the help, the reported errors are mostly errors caused by missing CONFIG definitions. The reason this option is included is that it can prove to be very useful in some cases. So in short, only the errors reported by the compiler count and the errors reported by the IDE can be used to fix errors while you edit.
Show Unused Items
When this option is turned on, all unused items will be shown in grey. For example :
In this sample, _temp1 , so_rx_data and DataPtr are unused or unreferenced. _temp1 is an internal variable and so is DataPtr. They do not occupy any space.
But so_rx_data is a user variable which is not referenced. You could remove or remark it.
Refresh
This option will parse the project and update the code explorer tree.
Find References
This option can find all references for an item. For example when you go to Variables, and select a variable the option becomes enabled in the menu. After choosing this option, the references will be added to the tree.
Now by clicking the item you will go to the point in your code where the item is referenced.
| Languages | English • Deutsch |
|---|


